(Picture provide by wisheights.k12.wi.us.math.algebra.)
Title: Involving Excel with running and math.
Objective: Teach students with enough skills in order to use Excel to create a linear graph by using collected data from the cross country races, and runners’ times for every race. The main objective from this project is for the students to be able to draw predictions from a pattern of data.
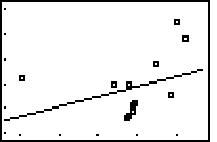
Prerequisite Knowledge and Skills: Before doing this lesson, my students would be taught to create a slop intercept form equation (y = mx + b) by using two points in a plane(x,y),(x,y) . In addition, the student would be taught to use the slope intercept form equation in order to make a linear graph. The purpose of these lessons is for the students to become familiar with graphing by using equations. Following more, the students would be taught to use Excel in order create a scatter plot graph by using two groups of numbers. One group would be used as the (x) axis values and the other group as (y) axis values (in order to create the scatter plot in excel, open excel then place the (x) number values on the first column and the (y) number values on the second, then pressing the left button on the mouse and high light both of the columns. Following more, select “Insert” and them “Chart”. Finally, select “(xy) scatter”, name the x, and y axes values. Select finish and you would had have created a scatter plot graph). After the scatter plot graph is made, the students would create a linear graph(in order to crate a linear graph out of the scatter plot graph, right click on any of the point on the scatter plot graph, then press the right button on the mouse. Select “Add trendline” and chose “linear”, and a linear graph would appear covering most of the points). Finally, the students would be taught to create the slope intercept form equation, y = mx + b (in order to create the equation, right click on the linear graph. Then select “Format Trendline”, then select options, finally, select “Display equation on chart” and the slop intercept form equation would showed). Finally, after the equation is created, it would be used as a standard equation in order to draw any predictions relating to the scatter plot graph. For example, if the Scatter plot graph relates to fourteen groups of numbers on which every number represents a Cross Country race, and the (x) value is the number of the race and the (y) value is the time a runner run for that race, when replacing the x value on the equation for the fifteen race, the student would be estimating the time the runner would run for the fifteen race. Isn’t that awesome?
Materials and/or tools: the teacher would provide shits of paper, each representing a runner’s time for every race. Every shit would provide two lists of fourteen numbers. The first list of numbers for every sheet would represent the race number: race number one, number two, number three, etc. This first list would also represent the values for the (x) axis. The second list of numbers would represent the times that every runner ran for every race: 16.3 minutes, 16.8 minutes, 19 minutes, etc. The second list would also represent the values of the (y) axis.
The class would also need calculators and the computer lab.
Set up/Context: This Project is for tenth and eleventh grade algebra level. This activity will take about three class meeting. The activity would take place on the classroom during the first day, and on the computer lab on the second and third day.
Process/Instructions:
During the first day, the students would be taught to create a slop intercept form equation, and its proper method to graph it.
During the second day, the students would be taught to use Excel in order to create scatter plot graphs, linear graphs, and slop intercept form equations.
Finally, on the third, the teacher will hand shits with Cross Country runner’s times on fourteen races. The students would use these times number of the race in order to create a linear graph and its slop intercept form equation, whit this information the student would be asked to predict the time for the fifteenth and sixteenth race.
Out come: After completing this activity the learner would be able to predict a pattern of group of numbers, such as, the relation ship between age and grade point average, age and shoe size, races and the runners times for that race, etc.
Evaluation: During the completion of the project the instructor would be assisting the students with any questions in order to ensure that they are following the proper procedures. In addition the students would be quized in order ensure that they learned the material. After completing the projects the teacher would collect the projects in order to grade them. In order to find out how well they did, the students would receive a grade a day after completing the project.
Follow up: After completing the project the students would be assigned with a work sheet, on which six pairs in a plane would be included. The student would have to connect every two points with a line. Following more, the students would create six slop intercept form equations from every two points connected. A final question would be added in the work sheet on which the students would be asked to compare the method of creating line graphs with
posted by Anonymous at 12/10/2005 04:20:00 PM
![]()

1 Comments:
This is an awesome idea Ismael! This would be a great in-class assignment that could motivate students to both get active and learn math! You listed a great amount of objectives the students would be learning. This would be an activity that I would use if I was in the position of teaching mathmatics. Great work! It's been a pleasure working with you! Que tenga buen navidad! Cuidate
Post a Comment
<< Home